Tangible Interaction · Final project
The Invisible Passenger
A cabin microclimate behavioral study: how long before a driver notices stale air, and can a display change what they do about it?
- V1 · BenchESP32 and an LED blink on a breadboard
- V2 · SensorsMQ-135, HC-SR04 and LCD wired, Adafruit IO streaming
- V3 · CabinDevice on the center console, 7 days of live data
- Portraitp5.js heatmap built from the week of readings
01 · Question
How blind are we to the air we breathe while driving?
Carbon dioxide, humidity and VOCs build up silently during every drive. The project uses a shikake: a physical or psychological trigger that invites behavior change without commanding it. Rather than showing a warning, the device breaks the visual harmony of an otherwise calm display, so the driver acts because something looks wrong.
02 · Device
Three iterations, bench to cabin.
- MCU
- Adafruit ESP32 Feather (Wi-Fi)
- Air sensor
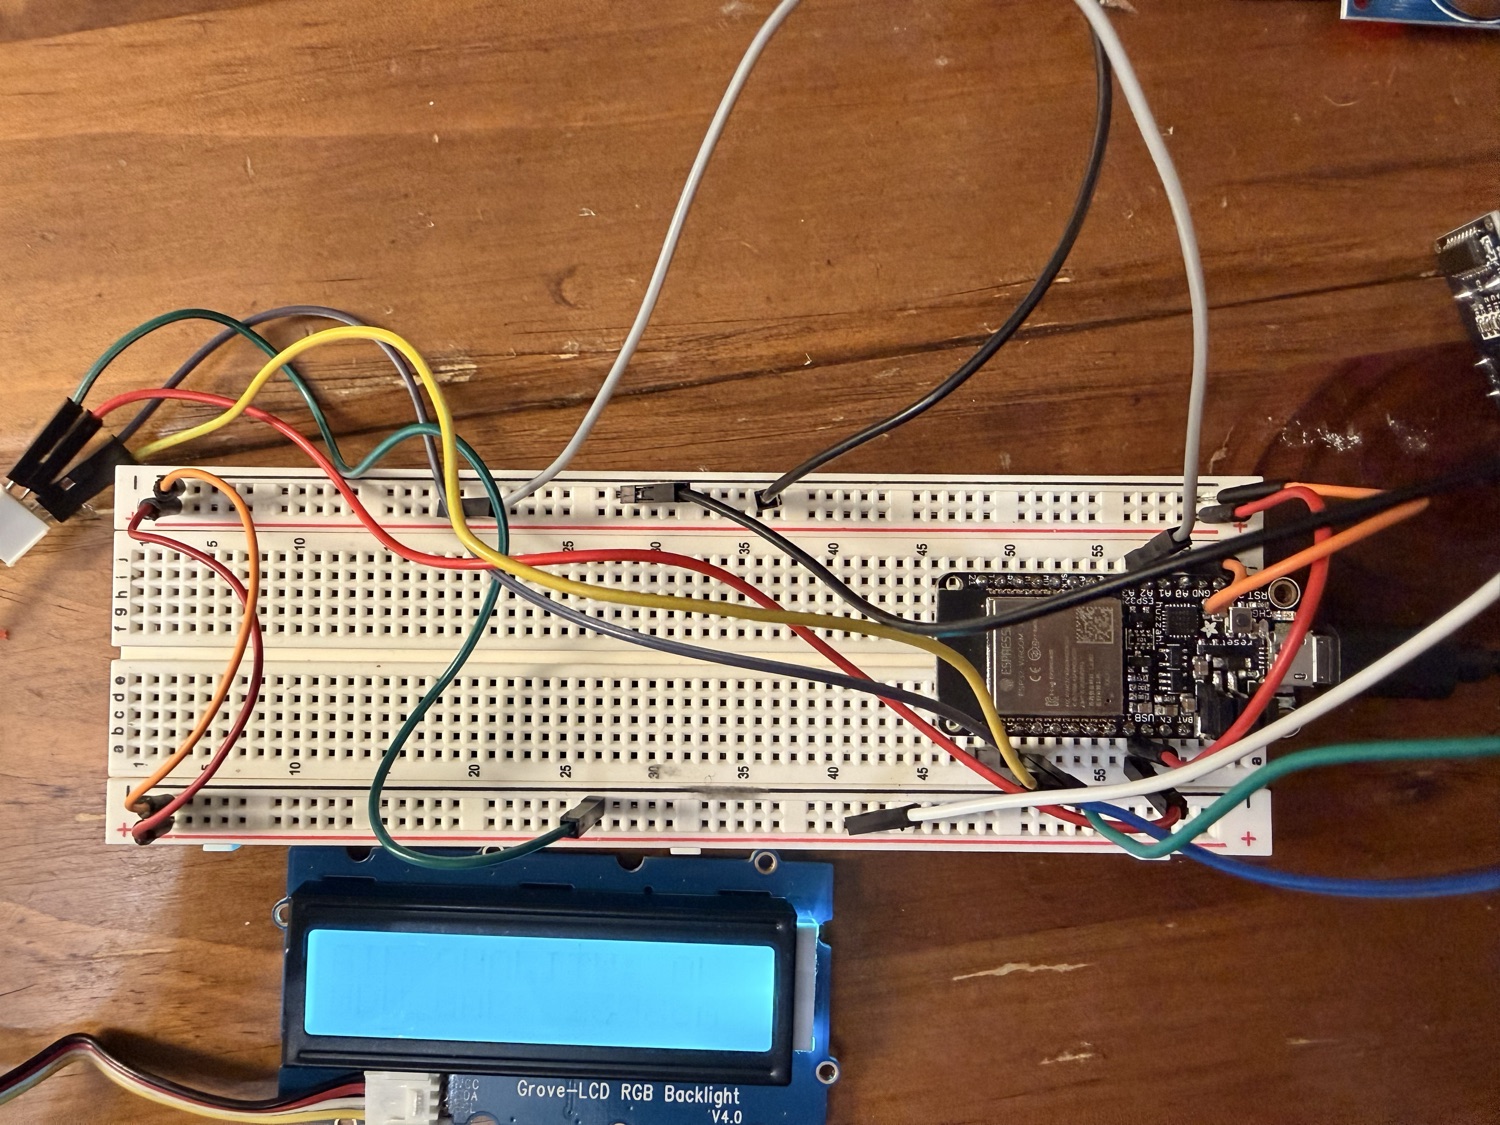
- MQ-135 gas sensor, analog pin A2
- Window sensor
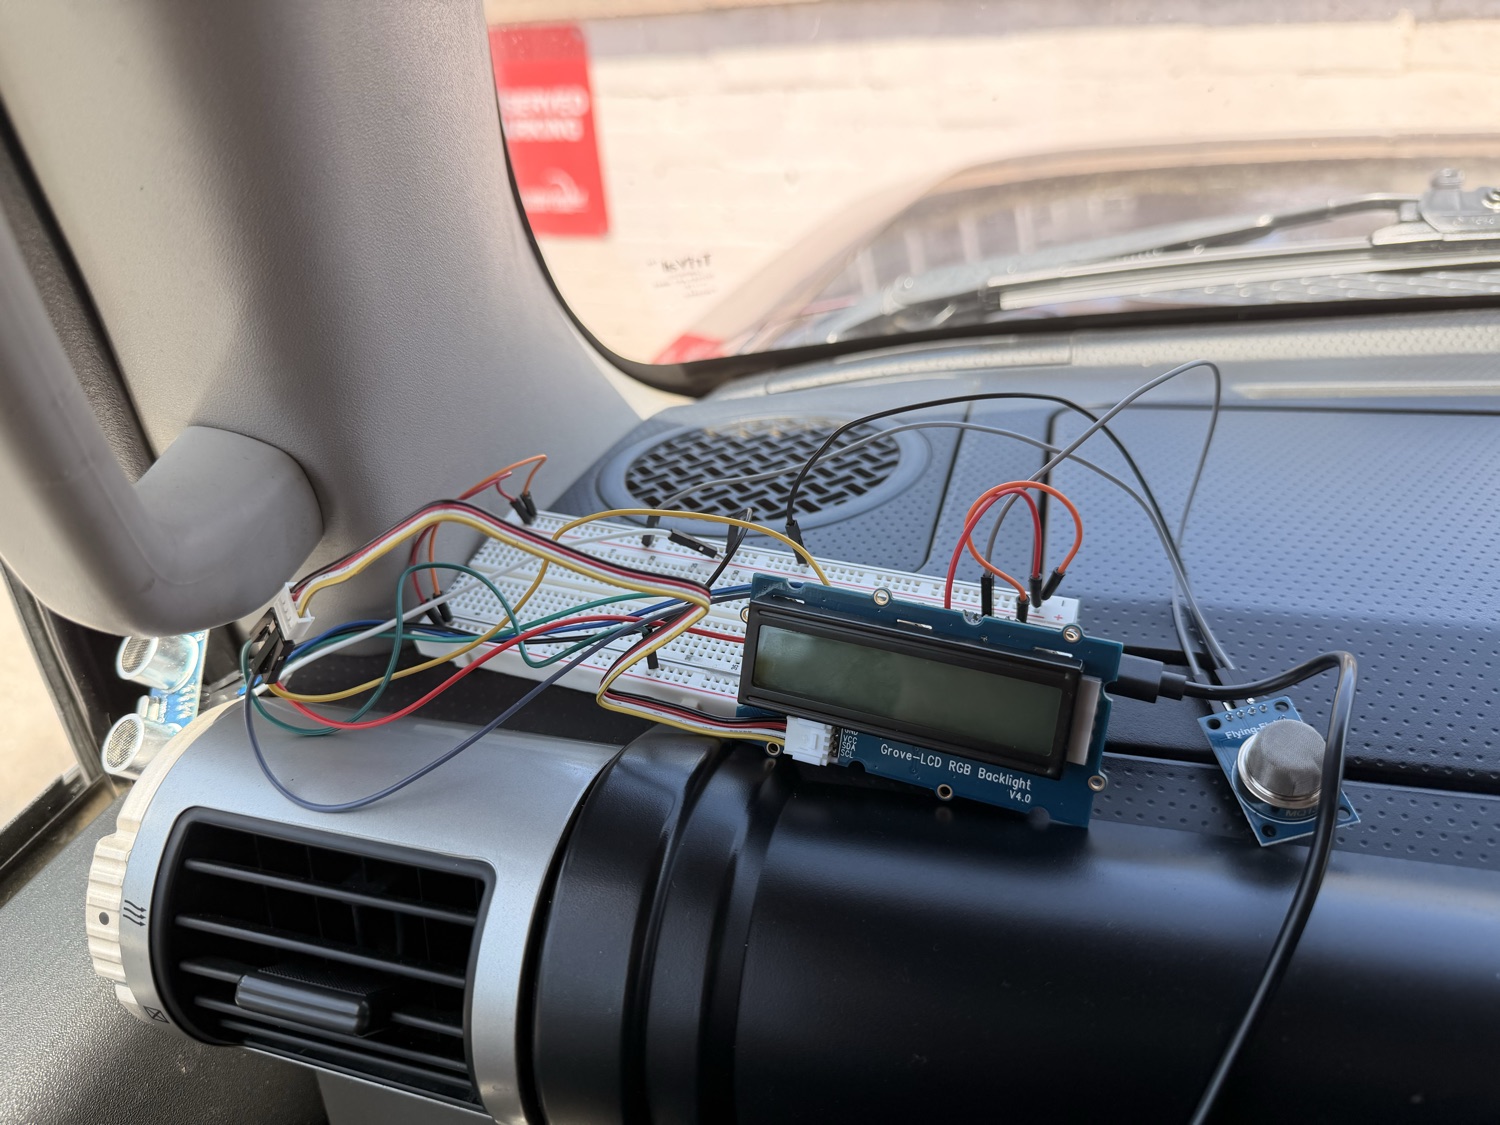
- HC-SR04 ultrasonic, measuring the gap at the driver-side window
- Display
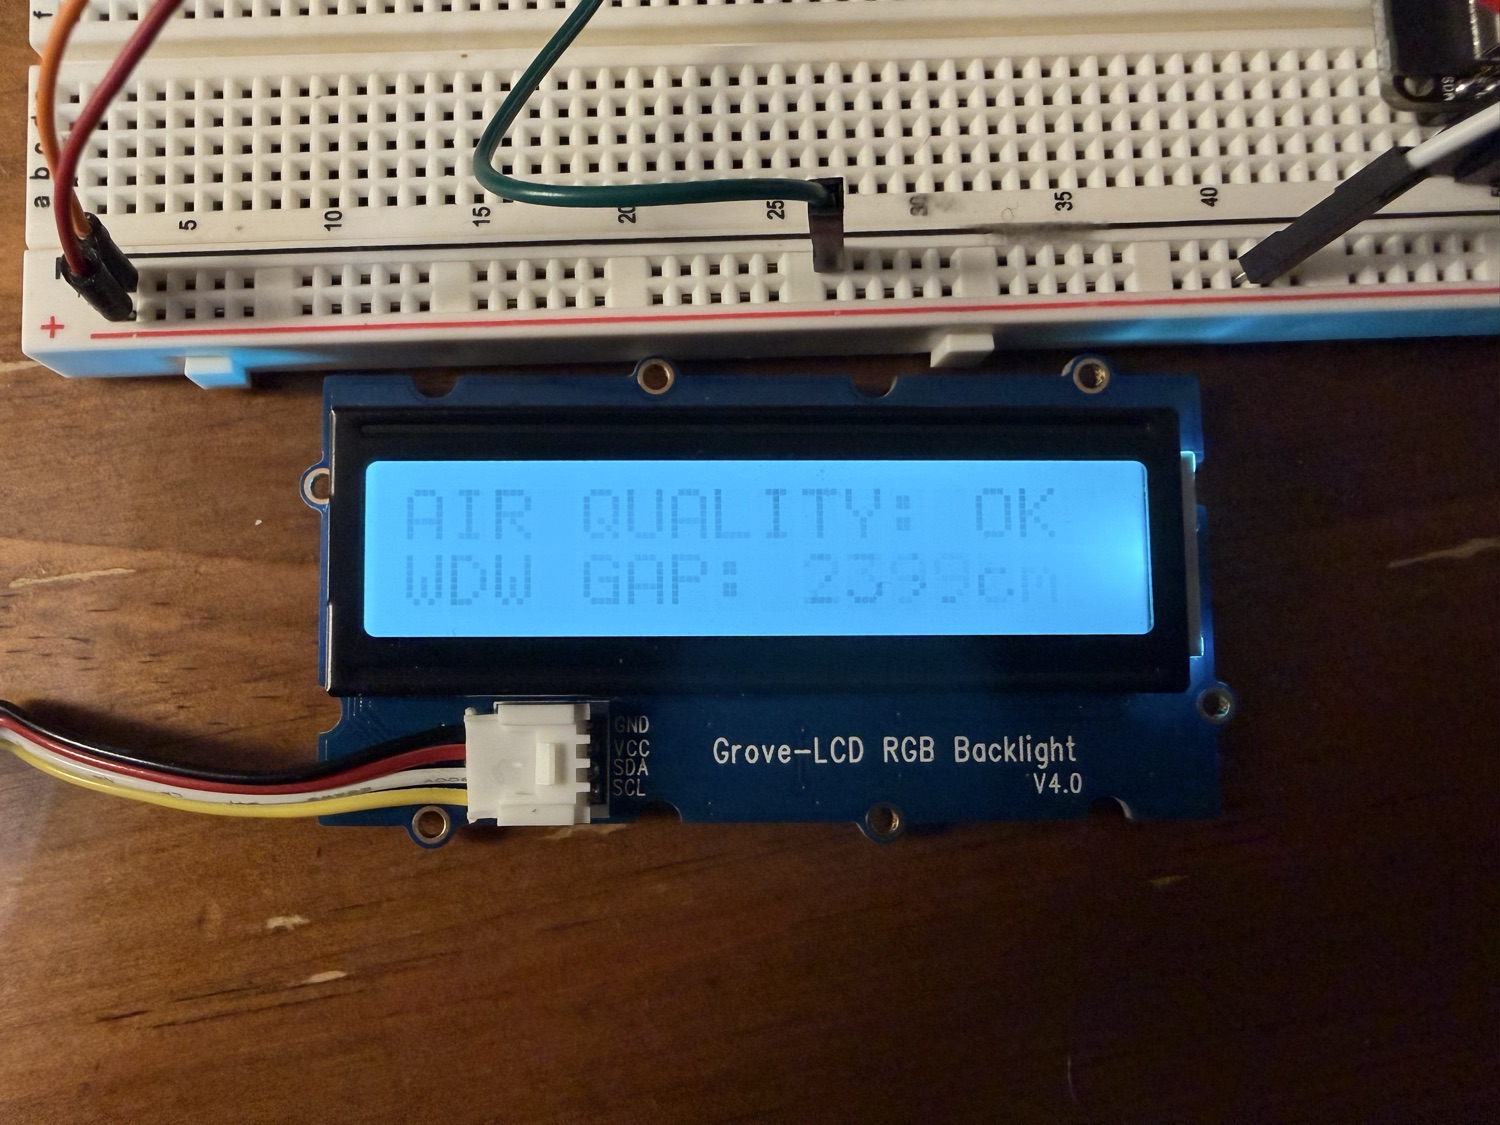
- Grove LCD RGB backlight over I²C
- Cloud
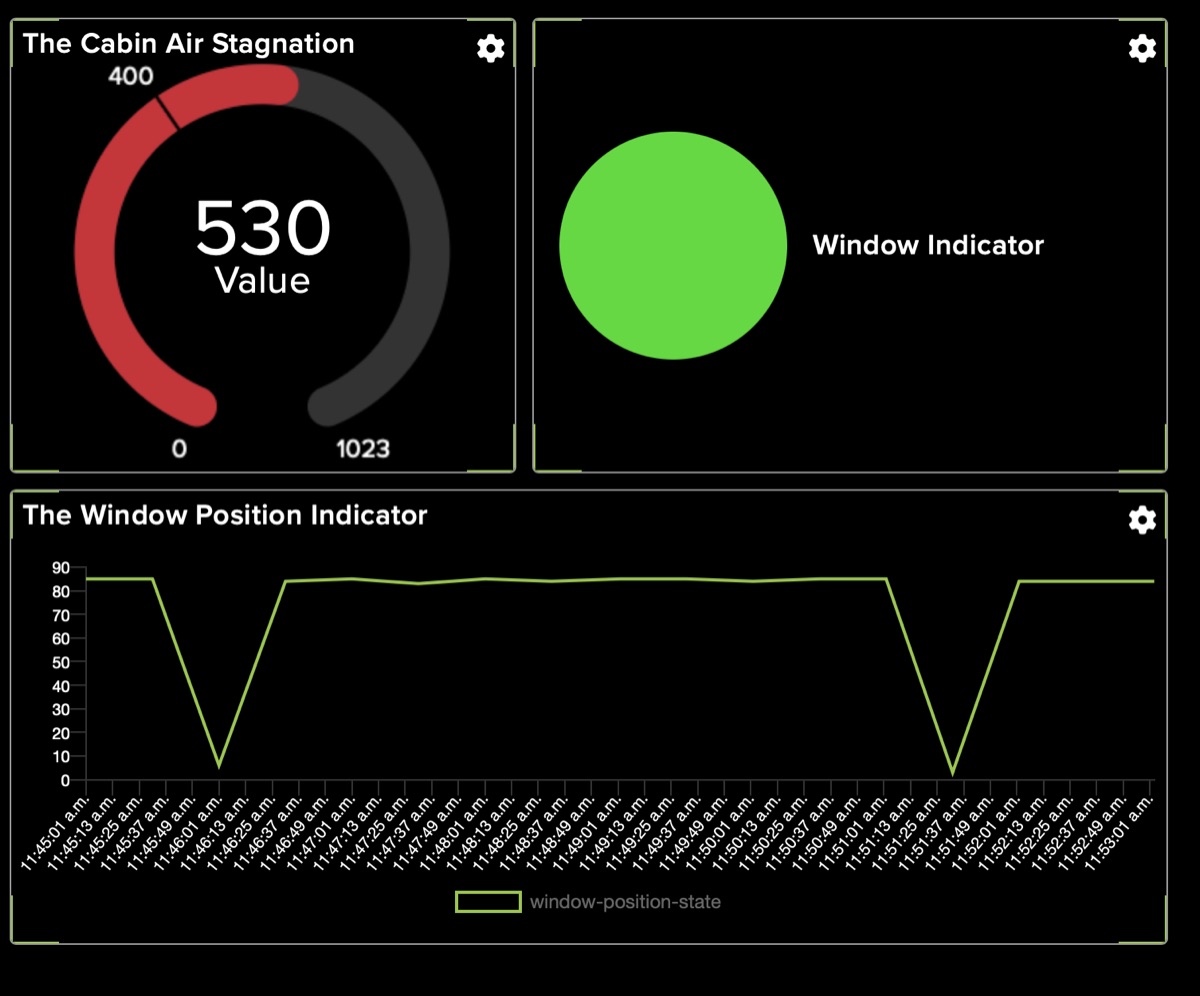
- Adafruit IO, two feeds, 30-second sampling
Bench prototype
ESP32 and an LED blink on a breadboard. Established the serial pipeline, confirmed sensor pin mappings and resolved USB port conflicts between the Arduino IDE and Processing.
Sensor integration
MQ-135 and HC-SR04 wired, LCD on I²C, Adafruit IO feeds streaming over a phone hotspot (needed a 2.4 GHz compatibility fix).
Cabin deployment
Secured on the center console with the ultrasonic sensor aimed at the driver-side window, powered from a USB-C power bank for seven days of live data.
The shikake
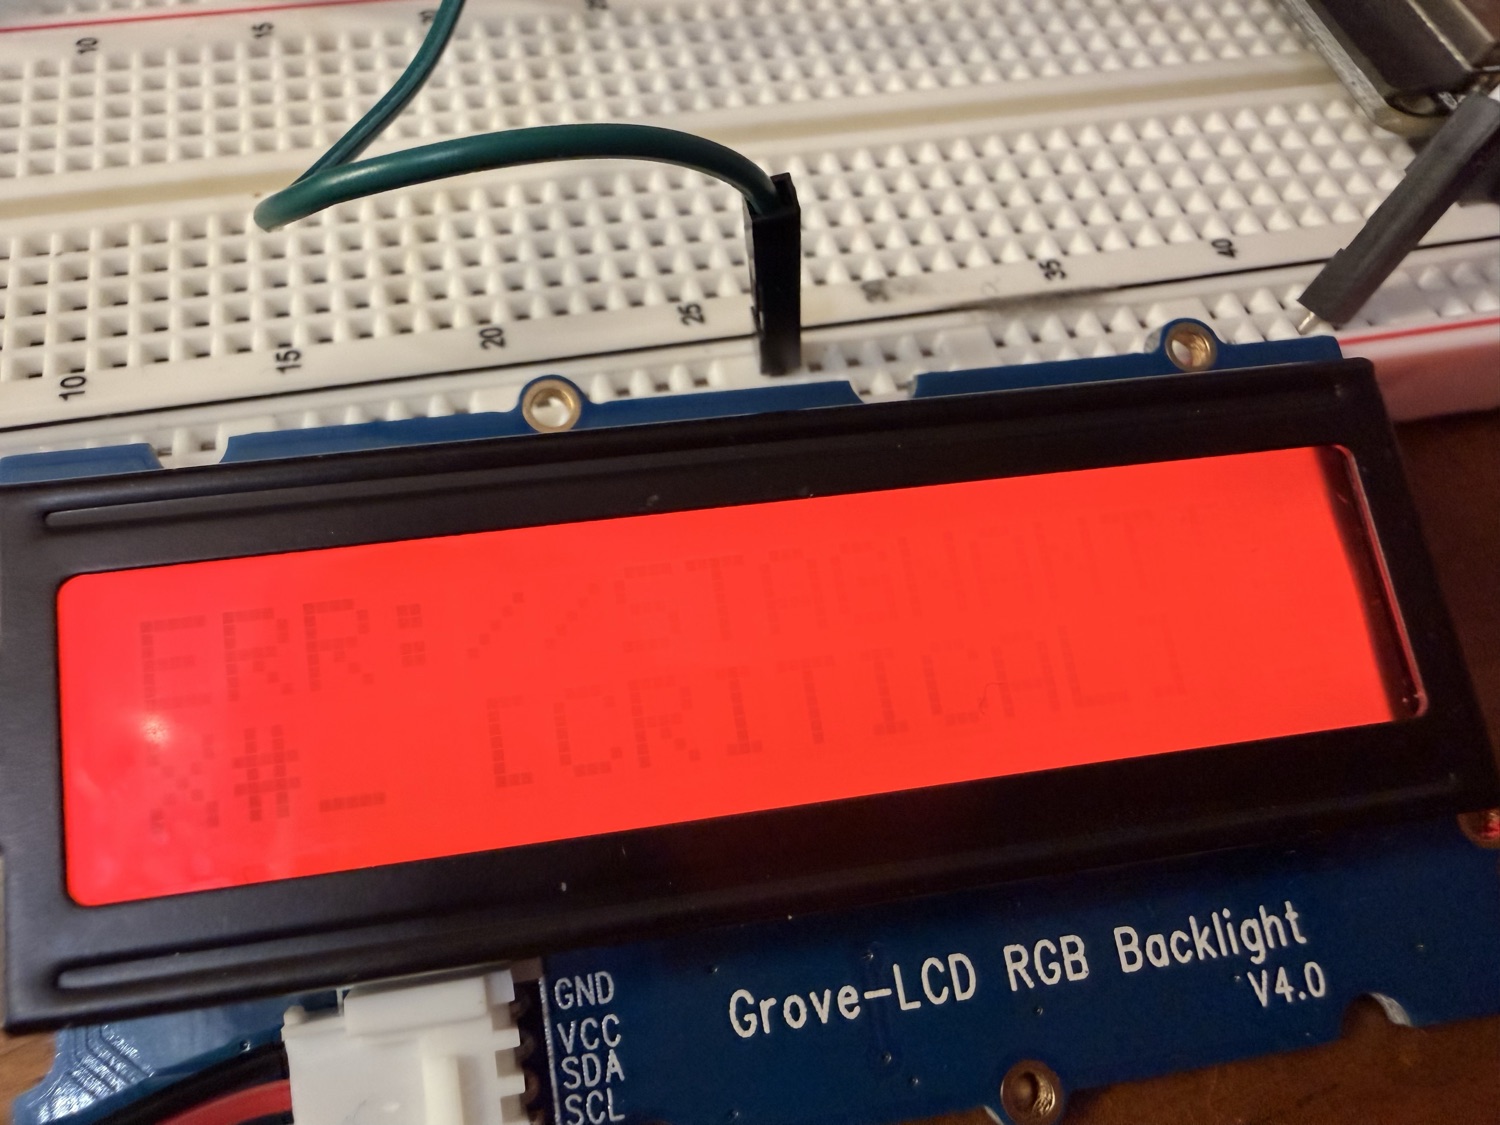
When air quality passed a threshold with the window closed, the LCD switched to a red backlight with a broken text pattern. It only stood out because the rest of the time the display had faded into the console.
03 · Data
The constraint shaped the insight.
A 30-second sampling interval kept the project inside Adafruit IO's rate limits, and it turned out to be enough to capture the slow rise of cabin stagnation.
2
Feeds
air stagnation, window position
30s
Sample rate
~2,880 points per day
7
Days
~20,160 readings
Kept
- MQ-135 analog voltage (0–1023)
- Window gap in centimeters
- Driving and parked periods, timestamped
Filtered out
- First 5–10 minutes of sensor burn-in
- Fluctuations under 5 units
- Short-echo readings under 3 cm
04 · Portrait
A week of air, one strip per day.
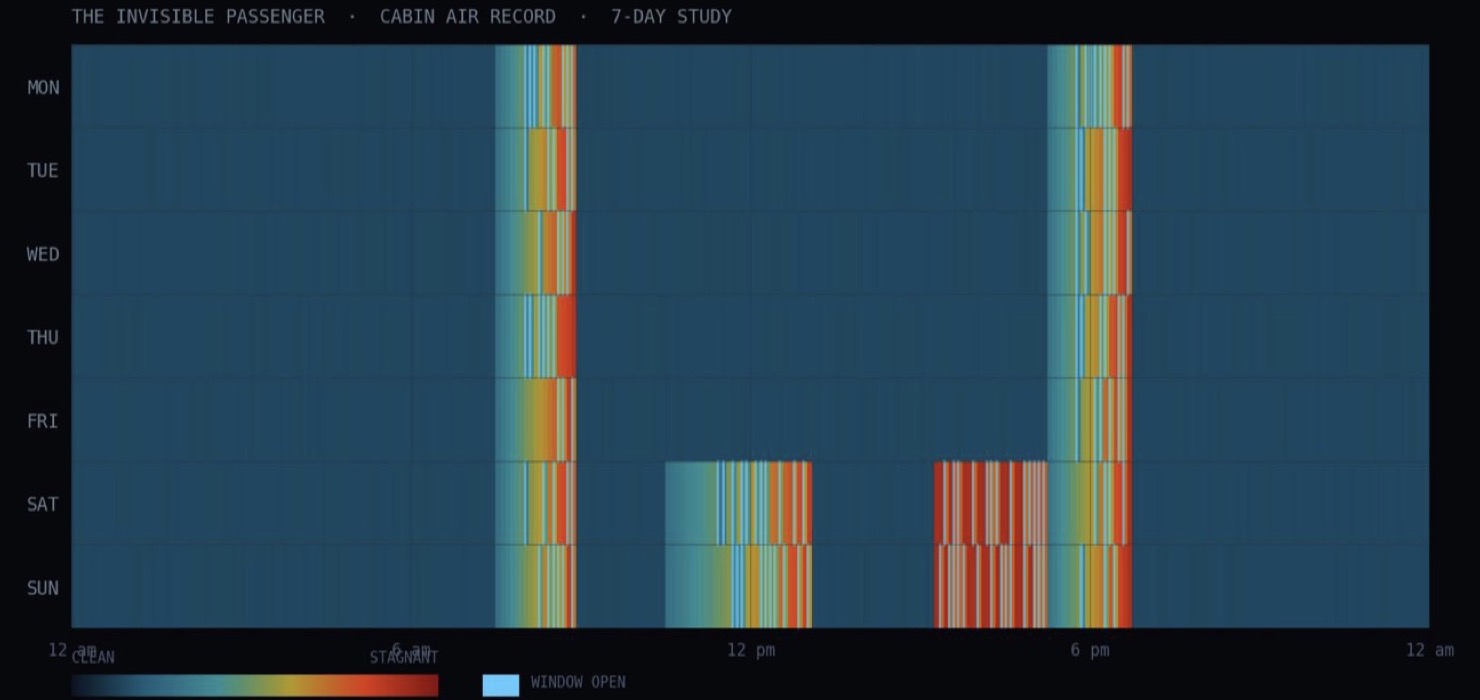
The p5.js visualization lays out seven day-strips from clean (teal) to stagnant (amber to red), with cyan flashes where the window was opened. The commute blocks are obvious, and so is the weekend afternoon drive.
05 · Reflection
What the system revealed, and what it couldn't.
Revealed
- Air quality degraded within 8–12 minutes of a window-sealed drive, on all 7 days.
- Window-open events became more frequent after day 2 of deployment.
- Morning commutes stagnated more than evening ones.
- Weekend drives had more window-opening events.
Couldn't
- The MQ-135 is a proxy: it can't separate CO₂ from VOCs.
- No occupancy data, so a solo commute and a carpool look the same.
- The shikake effect is inferred, not proven.
- One vehicle, one week: it may not generalize.